Quantitative individual UMAPs per gene of interest
Run through the 10x Cellranger pipeline and velocyto for single cell RNAseq quatification and using (2) guides quantifiction. all found in the cellranger files folder bash
Guide Calling for dual guide. Use repogle method to take molecule.h5 generated by cellranger and py to run through repogle version of guide calling or use cellranger_guidecalling.ipynb for Direct Capture Perturb-Seq dual guide. Formed guide-specific lists of cells.
Pseudobulk analysis. A. Seperation of guide-specific fastq files. bash B. Whippet pseudobulk for transcript specific analysis, post UMI deduplication. bash C. Transcript quality control. R D. Whippet result visualisation.
Normalisation of adata object and E-distance of KD
Check gene and neighboring gene expression
Create individual umaps per gene of interest A. UMAPs B. Rand Index score
Cell phase assignment model from FUCCI-matched single cell paper (GSE146773_)
Differential Expression analysis. A. Find the shared P1 and P2 genes. B. Check the shared P1 and P2 across different protospacers with the same A/B and C/D.
CNV Score & Numbat to quantify and Velocity quantification with loom file
ESR1-specific analysis from proliferation analysis to rt-qpcr
Spectra analysis and visualisation for pathway enrichment
This script focuses on using unsupervised learning and information theory to prove that alternative promoters drive distinct transcriptional states.
Visualization of Transcriptional Landscapes (UMAP & t-SNE) The primary goal of this notebook is to visualize how cells cluster based on which promoter (P1 or P2) was targeted.
What is happening: The code performs high-dimensional reduction using UMAP (Uniform Manifold Approximation and Projection) and t-SNE (t-distributed Stochastic Neighbor Embedding).
The Logic: If the two promoters were redundant, their respective cell populations would overlap completely. Instead, for genes like ESR1, BRIP1, and MYBB1A, the notebook generates plots showing cells segregating into distinct “clouds” or gradients based on the promoter knockdown
[1]:
%load_ext autoreload
%matplotlib inline
%autoreload 2
#general
import scanpy as sc
import matplotlib.pyplot as pl
import anndata as ad
import pandas as pd
import numpy as np
import hdf5plugin

#form a location
loc="alt-prom-crispr-fiveprime/"

import seaborn as sns
from tqdm.notebook import tqdm
import sys
sys.path.append(loc+'scripts/')
from apu_analysis import *
import scperturb
import infercnvpy as cnv
from apu_analysis.cell_import import CellPopulation
from IPython.display import clear_output
pd.options.display.float_format = '{:.4f}'.format
import matplotlib.pyplot as plt

#for this python
from scipy.special import rel_entr
import sklearn.cluster as cluster
import umap
from scipy import stats
from scipy.stats import bootstrap
import statsmodels.api as sm
from statsmodels.stats.multitest import multipletests
from numpy import reshape
from numpy import array
from sklearn.decomposition import PCA
import hdbscan

# Taken from:
# Adamson, B.A., Norman, T.M., *et al.* "A multiplexed CRISPR screening platform enables systematic dissection of the unfolded protein response", *Cell*, 2016.
# My experiment deals with two KDs- one of the MP, one of the AP using two guides. Positve controls include GINS1 ect. This is a combnatorial KD double for the same gene. No treatments were used

# colours using garvan
color1 ='#4d00c7'
palecolor1="#b366ff"
color2= '#da3c07'
palecolor2="#ff8954"
color3='#05d3d3'
color4='#c6c7c5'
color4="#434541"
color5="#eb31e1"
color6="#3175eb"
color7="#a7eb31"
color8="#b366ff"
color9="#ff8954"
color10="#35c9d4"

#use viridis
color1="#fde725"
color2="#7ad151"
color3="#22a884"
color4="#2a788e"
color5="#2a788e"
color6='#440154'
# %%capture


# Create the color palette
palette = sns.color_palette([palecolor1,palecolor2])
palette2 = sns.color_palette([color1, color2, color3, color4,color5,color6 ,color7])
umap_palette= sns.color_palette(["#F05325","#04AFBB"])
# Create the color palette
palette = sns.color_palette([color1, color2,color3])
new_palette = sns.color_palette([color1, color2,color1, color2,color1, color2,color1, color2,color1, color2,color1, color2, color3, color4])

#change palette to 3d82c4 36a047
palette=sns.color_palette(["#f3766e", "#7094cd"])
#change #36a047 to G1 #7671b3 toG2M and #d76127 to S
cellcycle_palette=sns.color_palette(["#36a047", "#7671b3","#d76127"])

print("Scanpy", sc.__version__)
%matplotlib inline
/Users/helenking/anaconda3/envs/apu/lib/python3.12/site-packages/tqdm/auto.py:21: TqdmWarning: IProgress not found. Please update jupyter and ipywidgets. See https://ipywidgets.readthedocs.io/en/stable/user_install.html
  from .autonotebook import tqdm as notebook_tqdm
Scanpy 1.10.3
[2]:
%%capture
adata = ad.read_h5ad(loc+"files/adata_normalised.h5ad")
adata.X=adata.layers["log1p"]
[3]:
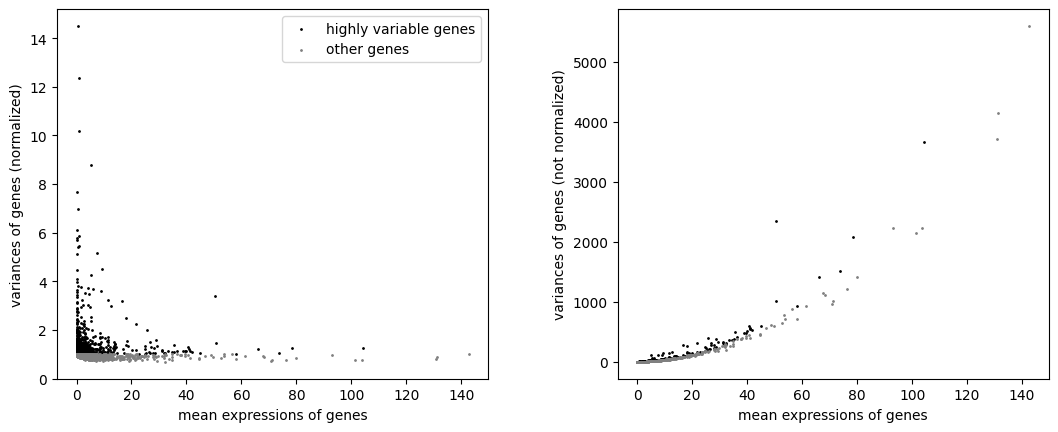
with plt.rc_context(): # Use this to set figure params like size and dpi
sc.pl.highly_variable_genes(adata,show=False)
plt.savefig(loc+"figures/hvg.pdf", bbox_inches="tight")
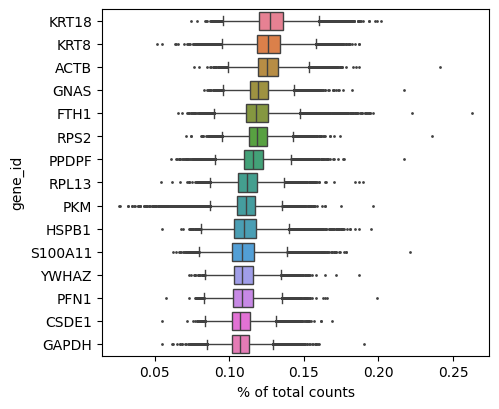
with plt.rc_context(): # Use this to set figure params like size and dpi
sc.pl.highest_expr_genes(adata, show=False,n_top=15)
plt.savefig(loc+"figures/heg.pdf", bbox_inches="tight")
[5]:
##figure2
#change plot figure
plt.rcParams['figure.figsize'] = [5, 5]
#make prettier
sns.set(style="white")
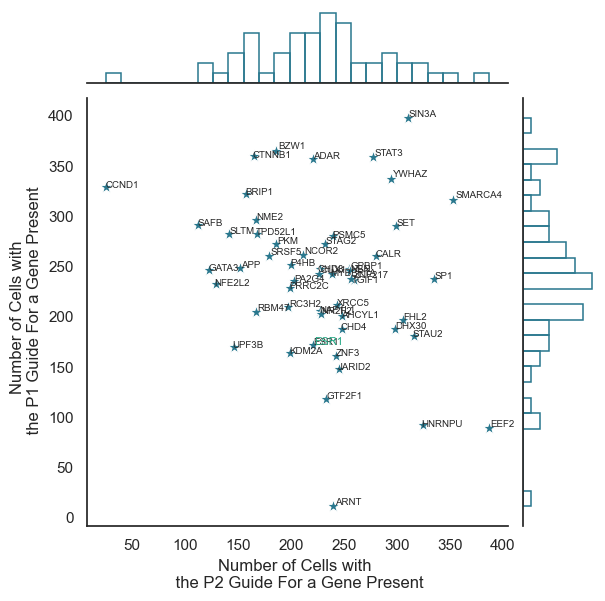
#check if AP and MP present for each gene
value_counts_p1p2=adata.obs[["perturbation","promoter_type"]].value_counts().reset_index()
value_counts_p1p2=pd.DataFrame(pd.pivot(value_counts_p1p2,index='perturbation', columns="promoter_type",values="count")).reset_index()
sns_plot=sns.jointplot(data=value_counts_p1p2, x="AP",y="MP", color=color5,
marker="*", s=100, marginal_kws=dict(bins=25, fill=False),
)
for i in range(value_counts_p1p2.shape[0]):
#randomn number between 0 and 1
random_1=np.random.uniform(-2,2)
x_coord=value_counts_p1p2.AP[i]+random_1
y_coord=value_counts_p1p2.MP[i]+random_1
name=value_counts_p1p2.perturbation[i]
plt.text(x=x_coord,y=y_coord,s=name, fontsize=7)
if value_counts_p1p2.perturbation[i]=="ESR1":
#style bold
plt.text(x=value_counts_p1p2.AP[i]+0.3,y=value_counts_p1p2.MP[i]+0.3,s=value_counts_p1p2.perturbation[i], fontsize=8,color=color3)
plt.xlabel("Number of Cells with \n the P2 Guide For a Gene Present")
plt.ylabel("Number of Cells with \n the P1 Guide For a Gene Present")
#save plot in pdf form
output_fig_loc=loc+"figures/4_5_quality_control/"
sns_plot.figure.savefig(output_fig_loc+"cellcount_perprom.pdf")
plt.show()
WARNING:matplotlib.text:posx and posy should be finite values
WARNING:matplotlib.text:posx and posy should be finite values
WARNING:matplotlib.text:posx and posy should be finite values
WARNING:matplotlib.text:posx and posy should be finite values
WARNING:matplotlib.text:posx and posy should be finite values
WARNING:matplotlib.text:posx and posy should be finite values
WARNING:matplotlib.text:posx and posy should be finite values
WARNING:matplotlib.text:posx and posy should be finite values
[6]:
loc="alt-prom-crispr-fiveprime/"
# specify parameters and distributions to sample from
# genelist=list(pop.cells["perturbation"][(pop.cells["perturbation"]!="control") & (pop.cells["perturbation"]!="NegCtrl3b")].drop_duplicates())
genelist=adata.obs["perturbation"].drop_duplicates().values
#remove non-targeting
genelist=[x for x in genelist if x != "non-targeting"]
hyperparam_list=[]
best_list_list=[]
[7]:
#calculate the highly variable genes
sc.pp.highly_variable_genes(adata, n_top_genes=1500, flavor="seurat_v3", n_bins=20)
/Users/helenking/anaconda3/envs/apu/lib/python3.12/site-packages/scanpy/preprocessing/_highly_variable_genes.py:75: UserWarning: `flavor='seurat_v3'` expects raw count data, but non-integers were found.
  warnings.warn(
[8]:
highlyvariable_genes=adata.var.index[(adata.var["highly_variable"]==True) | (adata.var.index.isin(genelist))]
#add highlyvariable_genes to the targetggene list
adata_sub=adata
adata_sub.obs.index=adata_sub.obs["cell_barcode"]
#subset the highly variable genes
adata_sub=adata[:,highlyvariable_genes]
new_popmatrix_no_duplicates=pd.DataFrame(adata_sub.layers["log1p"])
# new_popmatrix_no_duplicates=pd.DataFrame(adata_sub.layers["sctransform"].todense())
#columns are genes, rows are cells
new_popmatrix_no_duplicates.columns=adata_sub.var.index
new_popmatrix_no_duplicates.index=adata_sub.obs.index
new_popmatrix_no_duplicates_read_count=new_popmatrix_no_duplicates.sum(axis=1)
[9]:
%%capture
#map a umap, calculate kl diveergence, and rand score
# genelist=["MYBBP1A","ESR1"]
# genelist=["MYBBP1A","ESR1", "PSMC5","BRIP1","STAT3","CHD4"]
#change the backgorun dto white
for gene in genelist:
    print(gene)
    ##list_guides from adata
    list_guides_df=adata_sub.obs[adata_sub.obs["perturbation"]==gene]
    list_guides=list(list_guides_df["guide_identity"].drop_duplicates())
    #find the gene name of interest
    if not list_guides:
        print("skip")
    if gene not in new_popmatrix_no_duplicates.columns:
        print("skip")
    else:
        #subset cells+in
        # cells_interest=new_popmatrix_no_duplicates[new_popmatrix_no_duplicates.index.isin(list_guides_df["cell_barcode"].drop_duplicates())]
        cells_interest=adata_sub.obs[adata_sub.obs.index.isin(list_guides_df["cell_barcode"].drop_duplicates())]
        # cells_interest["cell_barcode"]=cells_interest.index
        cells_interest=cells_interest.drop_duplicates(subset="cell_barcode")
        column_nopromotergene = [col for col in new_popmatrix_no_duplicates.columns if (('MT' not in col)&('Non' not in col)&('sg' not in col)&('_' not in col))]
        all=new_popmatrix_no_duplicates.loc[cells_interest["cell_barcode"],column_nopromotergene]
        #this creates one list that contains repeating elements one for
        list_rep=cells_interest["promoter_type"].values
        ##maybe make an if loop that if one of the types are not present then skip....
        list_rep=np.squeeze(pd.DataFrame(list_rep))
        # list_rep_cellcycle=cells_interest["phase"].values
        # list_rep_cellcycle=np.squeeze(pd.DataFrame(list_rep_cellcycle))
        standard_embedding = umap.UMAP(random_state=22).fit_transform(all)
        ##hyperparam
        hyper_paramlist=hyperparam(df = standard_embedding, list_rep=list_rep)
        best = best_validity(hyper_paramlist)
        clust_alg_eom = hdbscan.HDBSCAN(algorithm='best', alpha=1.0,
                                    approx_min_span_tree=True,
                                    gen_min_span_tree=True,
                                    cluster_selection_method=best['method'],
                                    metric=best['metric'],
                                    min_cluster_size=int(best['min_cluster_size']),
                                    min_samples=int(best['min_samples']),
                                    allow_single_cluster=False).fit(standard_embedding)
        best_list=pd.DataFrame(best).T
        best_list["gene"]=gene
        best_list_list.append(best_list)
        ##all
        df_list=pd.DataFrame(hyper_paramlist)
        df_list["gene"]=gene
        hyperparam_list.append(df_list)

        ###!!!plotting section !!!!####
        ##individual plotting
        fig, ax = plt.subplots(1, 1,  dpi= 600, facecolor='none')
        sns.set(style="white",font_scale=0.5,rc={'figure.figsize':(4,3)})
        sns_plot=sns.scatterplot(x=standard_embedding[:,1],y=standard_embedding[:,0],  hue=np.where(list_rep=="MP", "P1", "P2"),ax=ax,palette=palette)

        ###with cell cycle assignment
        # sns_plot=sns.scatterplot(x=standard_embedding[:,1],y=standard_embedding[:,0],  hue=np.where(list_rep=="MP", "P1", "P2"),ax=ax[0],palette=palette)
        # sns_plot=sns.scatterplot(x=standard_embedding[:,1],y=standard_embedding[:,0],  hue=list_rep_cellcycle,ax=ax[1],palette=cellcycle_palette)
        #place the legend outside
        # ax[0].get_legend().remove()
        # ax[0].legend(loc='center left', bbox_to_anchor=(1, 0.5))

        #tsne4.kl_divergence_
        ###!!!cluster!!!####
        print(best)
        fig, ax =plt.subplots(1,2)
        sns_plot=sns.scatterplot(x=standard_embedding[:,1],y=standard_embedding[:,0],  hue=np.where(list_rep=="MP", "P1", "P2"),ax=ax[0],size=8, palette=umap_palette)
        sns_plot=sns.scatterplot(x=standard_embedding[:,1],y=standard_embedding[:,0],  hue=clust_alg_eom.labels_,ax=ax[1], size=8, palette=umap_palette)
        #
        sns_plot.figure.savefig("alt-prom-crispr-fiveprime/figures/umap/"+gene+".pdf")
OMP: Info #276: omp_set_nested routine deprecated, please use omp_set_max_active_levels instead.
[10]:
#hyperparam
dataframe=pd.concat(hyperparam_list)
cols = ['metric','min_cluster_size', 'method','min_samples', 'validity_score', 'n_clusters','randscore','mutualscore' ,'gene']
dataframe.columns=cols
dataframe.to_csv("alt-prom-crispr-fiveprime/files/singlecell_shortread_analysis/hyperparam_cluster.csv")

#metric min_cluster_size method min_samples validity_score n_clusters randscore mutualscore   gene
dataframe=pd.concat(best_list_list)
cols = ['metric','min_cluster_size', 'method','min_samples', 'validity_score', 'n_clusters','randscore','mutualscore','gene']
dataframe.columns=cols
dataframe.to_csv("alt-prom-crispr-fiveprime/files/singlecell_shortread_analysis/best_cluster.csv")
[11]:
hyperparam_df=pd.read_csv("alt-prom-crispr-fiveprime/files/singlecell_shortread_analysis/hyperparam_cluster.csv",index_col=0)
best_df=pd.read_csv("alt-prom-crispr-fiveprime/files/singlecell_shortread_analysis/best_cluster.csv",index_col=0)
best_df.reset_index(inplace=True)
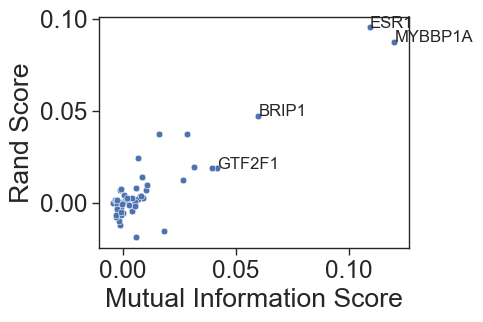
Quantifying Separation with Rand Index and Mutual Information To move beyond visual interpretation, the notebook uses rigorous statistical metrics to quantify how “different” the P1 and P2 populations really are.
Rand Index (Adjusted Rand Score): This measures the similarity between the “ground truth” (which promoter was targeted) and unsupervised clusters. A higher score confirms that the transcriptomic differences are strong enough for an algorithm to “guess” the targeted promoter.
Mutual Information (MI): This information-theory metric quantifies the amount of information obtained about the promoter perturbation by observing the cell’s transcriptome.
[12]:
#plot the validity_score randscore and mutualscore
sns.set(style="white")
sns.set_style("ticks")
sns.set_context("paper", font_scale=2)
sns.scatterplot(data=best_df, x="mutualscore", y="randscore", palette=palette)
#label the poiints abopve 0.04 mutual score
for i in range(best_df.shape[0]):
    if best_df.mutualscore[i]>0.04:
        plt.text(best_df.mutualscore[i],best_df.randscore[i],best_df.gene[i], fontsize=12)
#label the two

plt.xlabel("Mutual Information Score")
plt.ylabel("Rand Score")
plt.savefig("alt-prom-crispr-fiveprime/figures/umap/mutual_rand.pdf")
[75]:
adata.obs["gene"][adata.obs["successfulKD"]=="True"]
[75]:
cell_barcode
GTGTGCGGTTAGTGGG-1       NBN
TCAGATGAGCATCATC-1     PA2G4
GCAATCACACGACGAA-1       PKM
CACACAAAGCTGCAAG-1     SIN3A
GTCACGGGTTAAGTAG-1       SP1
                       ...
TAGCCGGAGCGTAATA-1     NCOR2
CTTGGCTTCAGCTTAG-1      CHD4
CATATGGAGGTGTTAA-1     GPBP1
TCTCTAAAGGAGCGTT-1     KDM2A
GGGAATGTCTTGACGA-1    CTNNB1
Name: gene, Length: 21657, dtype: category
Categories (50, object): ['ADAR', 'AHCYL1', 'APP', 'ARNT', ..., 'XRCC5', 'YWHAZ', 'ZNF3', 'ZNF217']
[79]:
vis_gene=["MYBBP1A","ESR1", "GTF2F1","BRIP1","STAT3","CHD4"]
subset_suc=adata.obs["gene"][adata.obs["successfulKD"]=="True"]

subset_suc[subset_suc.isin(vis_gene)].unique()
[79]:
['CHD4', 'ESR1', 'MYBBP1A', 'STAT3', 'BRIP1', 'GTF2F1']
Categories (50, object): ['ADAR', 'AHCYL1', 'APP', 'ARNT', ..., 'XRCC5', 'YWHAZ', 'ZNF3', 'ZNF217']
[13]:
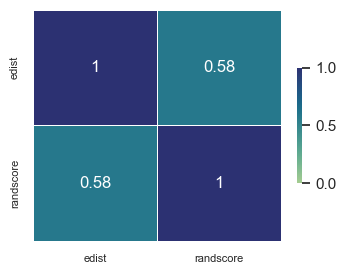
#read in edistance and check the correlation per gene
edistance=pd.read_csv("alt-prom-crispr-fiveprime/files/singlecell_shortread_analysis/edistance.csv",index_col=0)
edistance["gene"]=edistance.index.str.split("_").str[0]
edistance["promoter"]=edistance.index.str.split("_").str[1]
#merge edistance and best_df
edistance=edistance.merge(best_df, left_on="gene", right_on="gene")
#check correlation between edistance and randscore
#perform spearmans correlation between the two
edistance["edist"]=edistance["edist"].astype(float)
edistance["randscore"]=edistance["randscore"].astype(float)
sns.set(font_scale=1)  # crazy big

sns.heatmap(edistance[['edist','randscore']].corr(method="pearson"), annot=True, cmap="crest", linewidths=.5, vmin=0, vmax=1, cbar_kws={"shrink": .5})
#change the size of text
plt.xticks(fontsize=8)
plt.yticks(fontsize=8)
plt.savefig("alt-prom-crispr-fiveprime/figures/edistance_randscore.pdf")